Is there a universal average?
No verified dataset in this project establishes one population average across ages, devices, table designs, and rules. Publishing a precise cutoff without a sampling method, participant definition, task protocol, and uncertainty would create a number that looks authoritative without a sound basis.
Why grid size changes the task
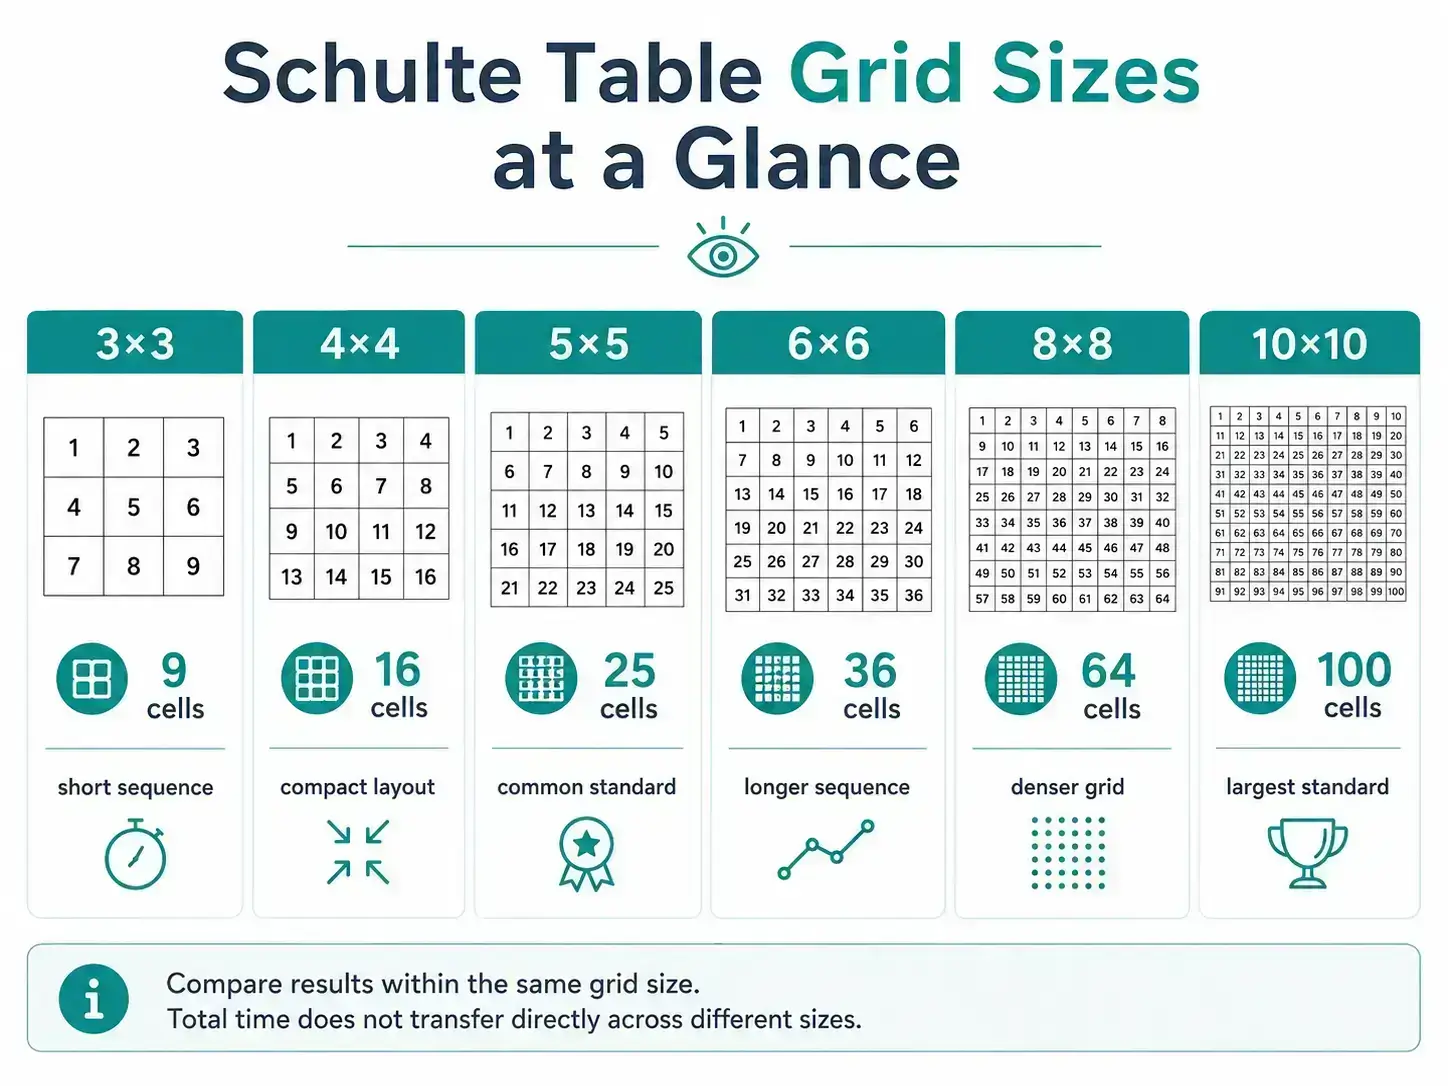
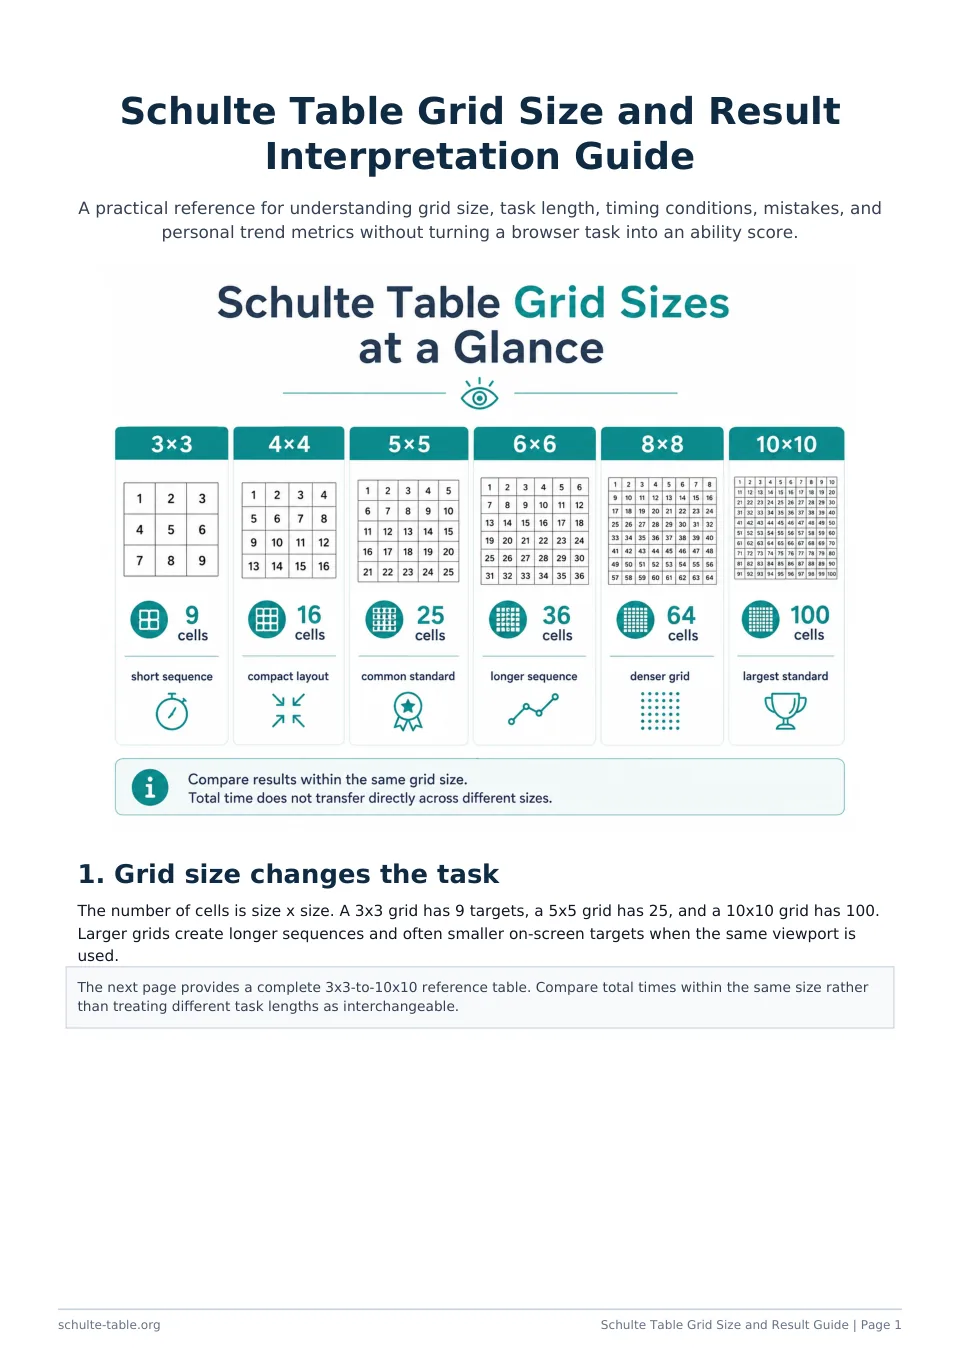
Cell count rises from 9 on 3×3 to 100 on 10×10. Each added target extends the required sequence, while extra rows can reduce target size in the same viewport. Total time from two sizes therefore answers two different task questions.
Mouse, touch, and keyboard are different input paths
A mouse pointer travels and remains visible at its last position. A finger can cover the target and move the device. Keyboard selection follows focus or number-key behavior. Keep input methods separate in the Progress Tracker instead of assuming one is always faster.
Screen size, orientation, and browser zoom
The same CSS layout can occupy different physical sizes on a phone, tablet, laptop, or monitor. Portrait versus landscape, page padding, and 100%, 125%, or 150% zoom change target geometry and visual travel. Record those settings when a strict comparison matters.
Errors belong beside time
Completion time alone omits wrong selections. If one mode counts or penalizes errors differently, its result is not like-for-like with another rule. Review time and mistakes together, and discard interrupted attempts rather than forcing them into a trend.
Median versus personal best
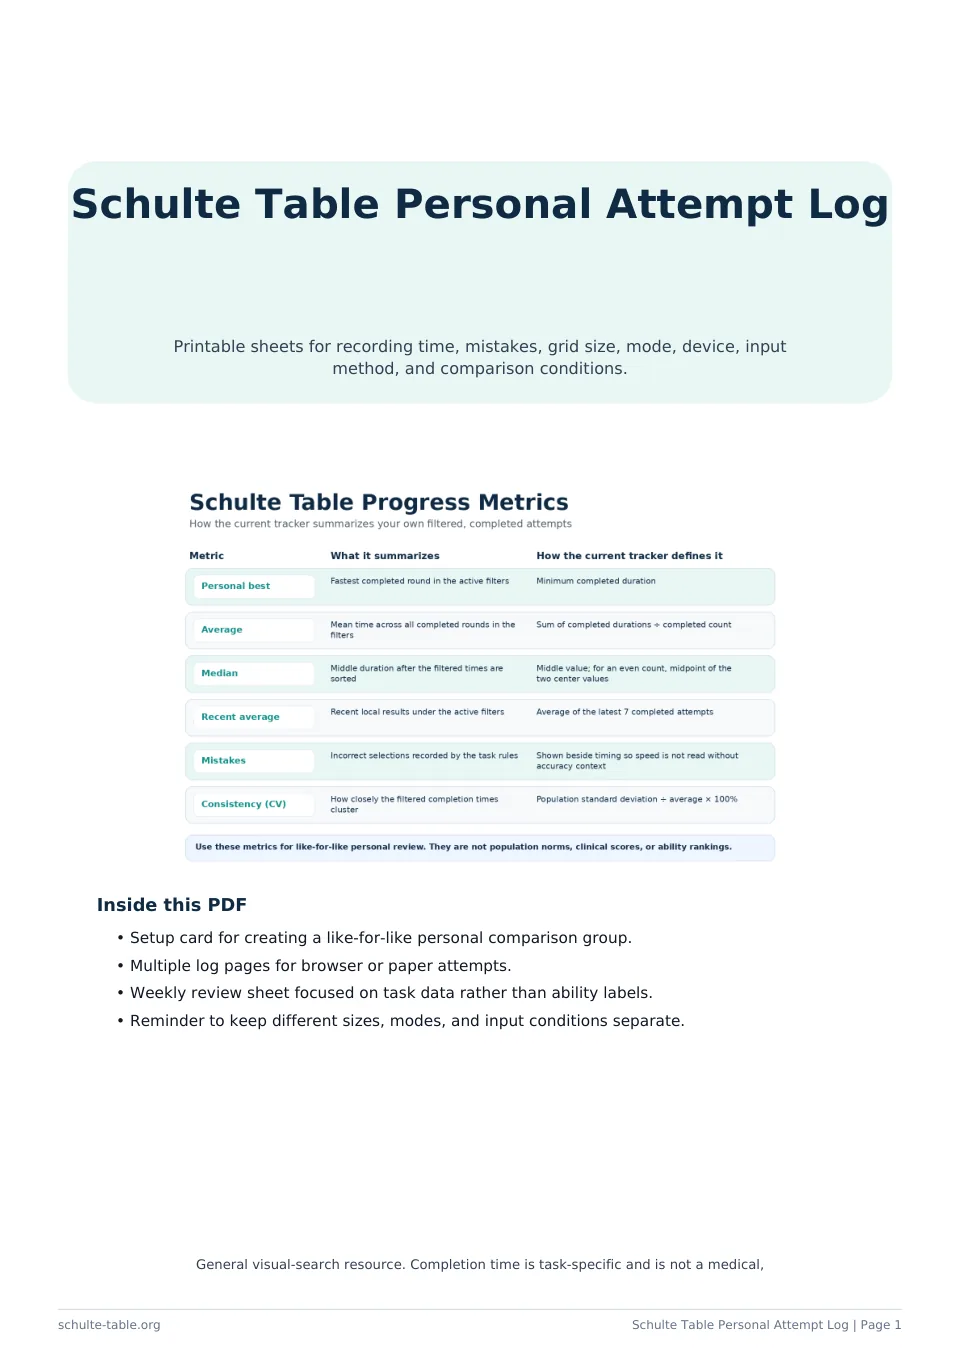
A personal best is the shortest saved completion and can be an unusual round. The median is the middle completed time after sorting, so it is less dominated by one extreme result. Review a median from several matching attempts beside the best and average mistakes.
Use the tracker and calculator for different jobs
The Progress Tracker filters saved browser records by grid, mode, completion, and input, then shows median, recent average, best, and errors. The Score Calculator transparently applies a site-defined error penalty to one entered result; it is not a population or ability score.
Limits of cross-size comparison
Seconds per cell can describe total time divided by cell count, but it does not make layouts identical: target density, sequence length, and input travel still differ. Keep a separate history for each size and use a neighboring grid only when you intentionally want a different task.